SQL Profiler
Overview
Microsoft SQL Server Profiler is a graphical user interface to SQL Trace for monitoring an instance of the Database Engine or Analysis Services. You can capture and save data about each event to a file or table to analyze later. For example, you can monitor a production environment to see which stored procedures are affecting performance by executing too slowly.
To run SQL Server Profiler, on the Start menu, point to All Programs, Microsoft SQL Server 2005, Performance Tools, and then click SQL Server Profiler.
Compliments of Microsoft MSDN Introducing SQL Server Profiler
Introduction
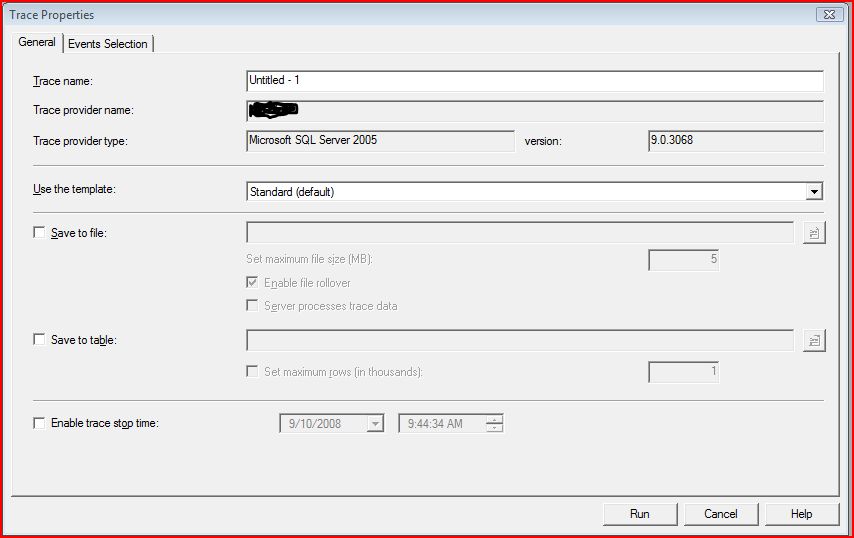
Output Parameters
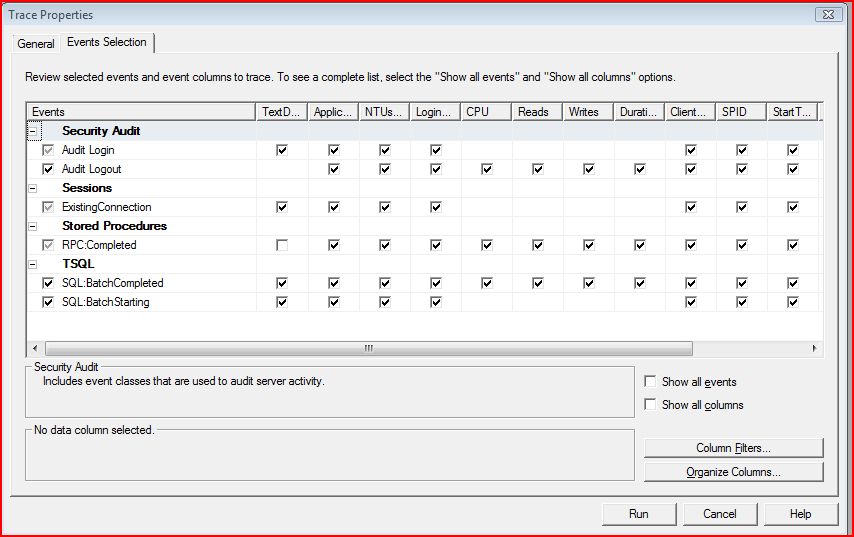
Event Selection & Filters
Tips & Tricks to solve Touchworks Issues
Many errors that one can receive in Touchworks can be traced back to its underlying SQL database calls using SQL Profiler.
Timing
Touchworks has many database calls happening concurrently and therefore makes profiling your SQL database challenging. One of the best tricks to narrowing the window of when your traceable instance will occur. I.E. If you have a known issue that you are attempting to profile, reproduce the workflow just short of the final critical step. Start the profiler trace. Produce the critical step to get the error, and stop/pause the profiler trace immediately.

